The Ultimate Guide to Netdata – Real-Time Server Monitoring Made Simple (With Cloud Support)
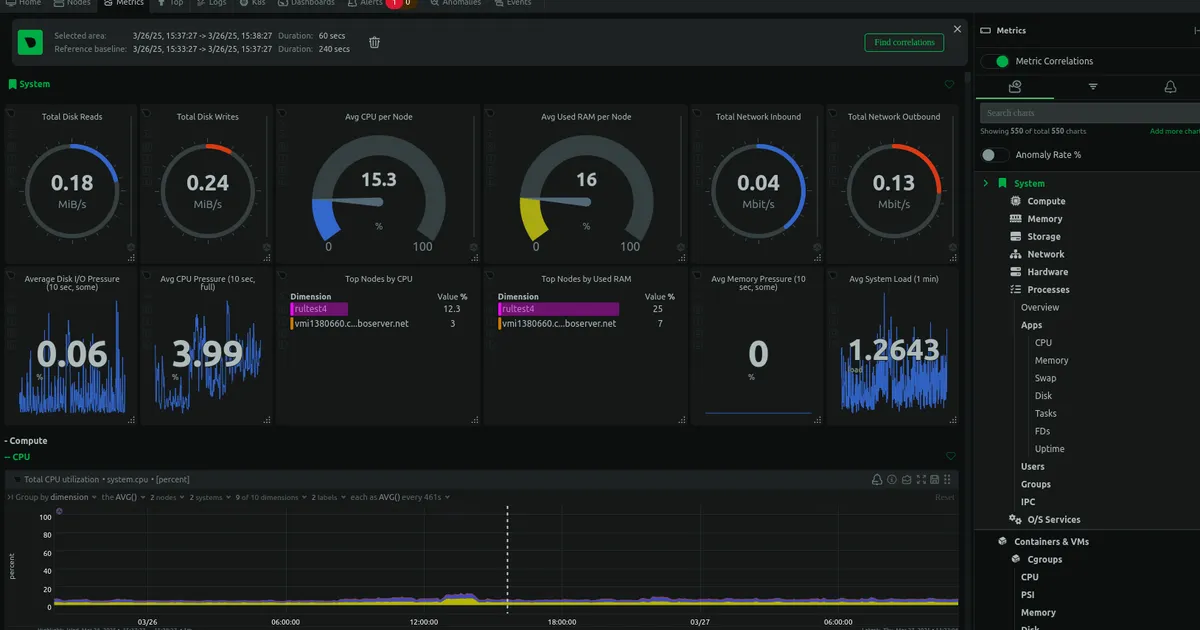
In a world where uptime, performance, and real-time visibility are essential, having a reliable monitoring system is not optional — it’s a necessity.
Whether you’re managing a single VPS, a network of cloud servers, or a Kubernetes cluster, you need to know what’s happening under the hood — every second. This is where Netdata becomes your secret weapon.
🧭 What is Netdata?
Netdata is a free, open-source monitoring solution that delivers real-time performance data for your entire infrastructure. It’s lightweight, blazing-fast, and packed with features that make it stand out from other monitoring tools.
It’s built for:
- System admins
- DevOps teams
- Cloud architects
- Developers
- Hobbyists and homelab enthusiasts
With Netdata, you get: ✅ Instant performance metrics
✅ 1-second data resolution
✅ Beautiful, interactive charts
✅ Built-in health checks & alarms
✅ Centralized cloud dashboard (Netdata Cloud)
💡 Try Netdata using my referral link — and support my work:
👉 Start with Netdata Now
💥 Why Use Netdata? (Key Features)
Here are just a few reasons why Netdata is blowing people away in the monitoring world:
⚡ 1. Real-Time Monitoring
Netdata updates every 1 second, giving you the most up-to-date insight into your system performance.
🌈 2. Beautiful & Interactive Dashboards
The UI is fast, intuitive, and packed with real-time graphs for everything from CPU and RAM to Docker containers and NGINX traffic.
🧠 3. Smart Alerts & Health Checks
Netdata comes with hundreds of pre-configured alarms. You’ll get automatic alerts if something’s off — even before things go wrong.
🧩 4. Plug-and-Play Support
Out-of-the-box support for:
- System metrics (CPU, RAM, disk, network)
- Applications (MySQL, NGINX, Apache, Redis)
- Containers (Docker, Kubernetes)
- Web servers, firewalls, and more
🌐 5. Netdata Cloud
Easily connect all your servers and systems to Netdata Cloud — a centralized, web-based dashboard to monitor everything from anywhere.
🪶 6. Lightweight
Netdata runs with minimal resource usage. You won’t even notice it’s there.
🛠️ How to Install Netdata (Local Monitoring)
🔧 One-Liner Installation (Linux):
bashCopyEditbash <(curl -Ss https://my-netdata.io/kickstart.sh)
This installs Netdata with automatic detection of your system and services. You can then access it via:
📍 http://your-server-ip:19999
🐳 Docker Installation:
bashCopyEditdocker run -d --name=netdata \ -p 19999:19999 \ -v netdataconfig:/etc/netdata \ -v netdatalib:/var/lib/netdata \ -v netdatacache:/var/cache/netdata \ -v /etc/passwd:/host/etc/passwd:ro \ -v /etc/group:/host/etc/group:ro \ -v /proc:/host/proc:ro \ -v /sys:/host/sys:ro \ -v /etc/os-release:/host/etc/os-release:ro \ --cap-add SYS_PTRACE \ --security-opt apparmor=unconfined \ netdata/netdata
You’ll get a fully functional, web-based dashboard within seconds.
☁️ Introducing Netdata Cloud: Monitor Everything, Everywhere
If you’re managing multiple servers, or just want one dashboard to rule them all, then Netdata Cloud is the answer.
✨ What is Netdata Cloud?
Netdata Cloud is a free platform that lets you:
- View and manage all your Netdata nodes in one place
- Organize systems by space and room (like projects or environments)
- Set up teams for collaborative monitoring
- Receive alerts and notifications (Slack, Discord, email)
- Analyze long-term trends across all your infrastructure
🌍 Access it here: Netdata Cloud
🔌 How to Connect a Node to Netdata Cloud
Once Netdata is installed:
- Visit
http://your-server-ip:19999 - Click “Connect this node to Netdata Cloud”
- Sign in (or sign up)
- Follow the simple onboarding steps
Done! You now have cloud-based monitoring of your system in real time.
💻 Real-World Use Cases
Here are just a few examples of how people are using Netdata:
- 🔥 Web Hosting: Monitor LAMP/LEMP stacks, databases, and network bottlenecks
- 🐳 Docker & Kubernetes: Monitor containers, pod resource usage, and node status
- 🎮 Game Servers: Check memory, CPU spikes, and latency issues in real time
- 🏠 Homelab: Monitor NAS devices, Raspberry Pi setups, or custom servers
- 🚀 CI/CD & DevOps: Get instant insights into build runners, cloud VMs, and environments
🤝 Help Me Out: Use My Referral Link
If you found this helpful and want to support my work, please consider signing up for Netdata using my referral link:
👉 https://netdata.cello.so/bZJj3rbvqVV
You’ll get the same amazing tool — and I’ll receive a small credit when you use this link. Win-win! 🙌
🧠 Final Thoughts
If you’re tired of clunky, complex monitoring tools, give Netdata a try. It’s:
- Free
- Fast
- Gorgeous
- Easy to use
- And it just works.
With Netdata Cloud, managing and visualizing your infrastructure has never been easier — from anywhere in the world.
⚡ Ready to get started?
👉 Start monitoring with Netdata (Referral)
🌐 Or jump straight into Netdata Cloud
Need help implementing any of this?
Talk to Code2Deploy about DevOps, CloudOps, and LLMOps consulting.
Contact us